What is true and what isn’t? Fancy guys from fancy universities with fancy degrees are telling you that this works! Why would they ever go after our money, they’re scientists after all!
Let’s start with the boring basics (made fun, ** take with a grain of salt **):
- Study type:
- Meta-Analyses/Systematic Reviews (STRONGEST) – pools results from multiple high-quality studies and confirms or denies their claims:

Figure 1 – Guzek et al (2022)
Now wait a minute, this does not mean that this is true — the “Abstract” section of the paper is the summary, and where you find your answer.
“”” the conducted systematic review is not a strong confirmation of the effectiveness of vitamin D supplementation in the treatment of depression.“””
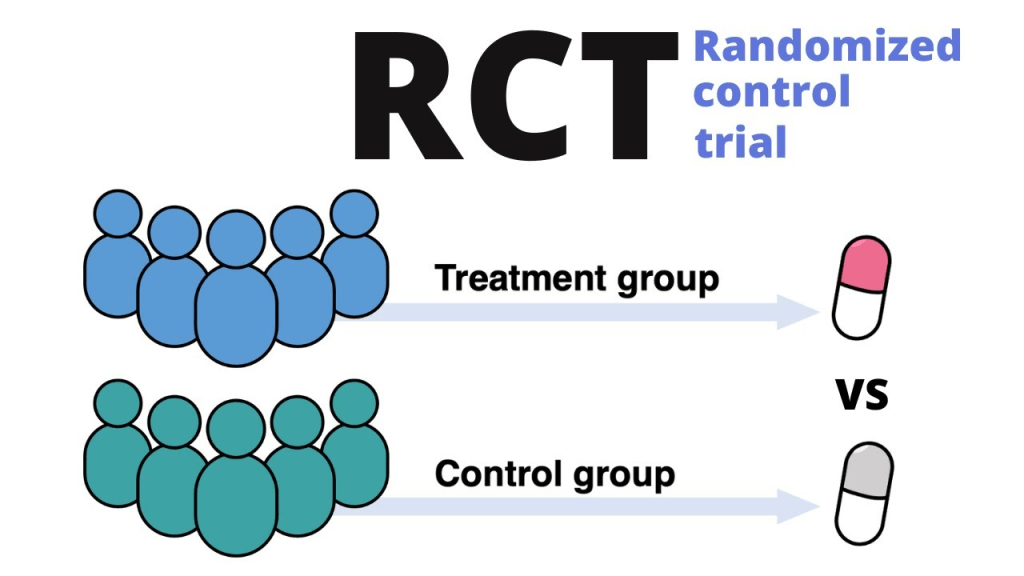
- Randomized Controlled Trials (RCTs) (STRONG) – directly tests the outcome, very simple:
- Cohort Studies (longitudinal, over time) (MODERATE) – looks at associations over time:
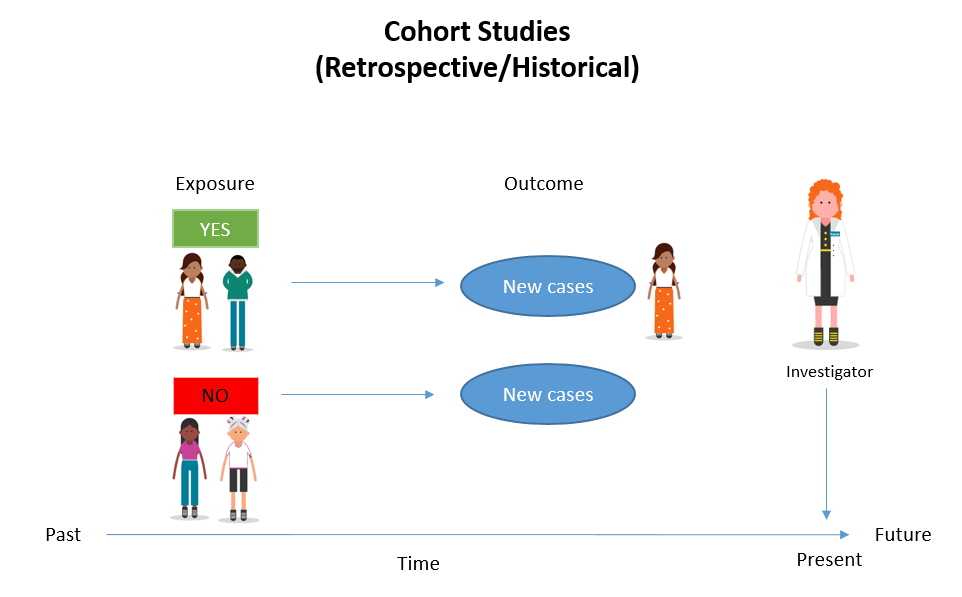
-Figure 2: Simkus (2023)
- Case-Control Studies (MODERATE/WEAK) – draw differences between people who have it and not, finding what cases have in common:
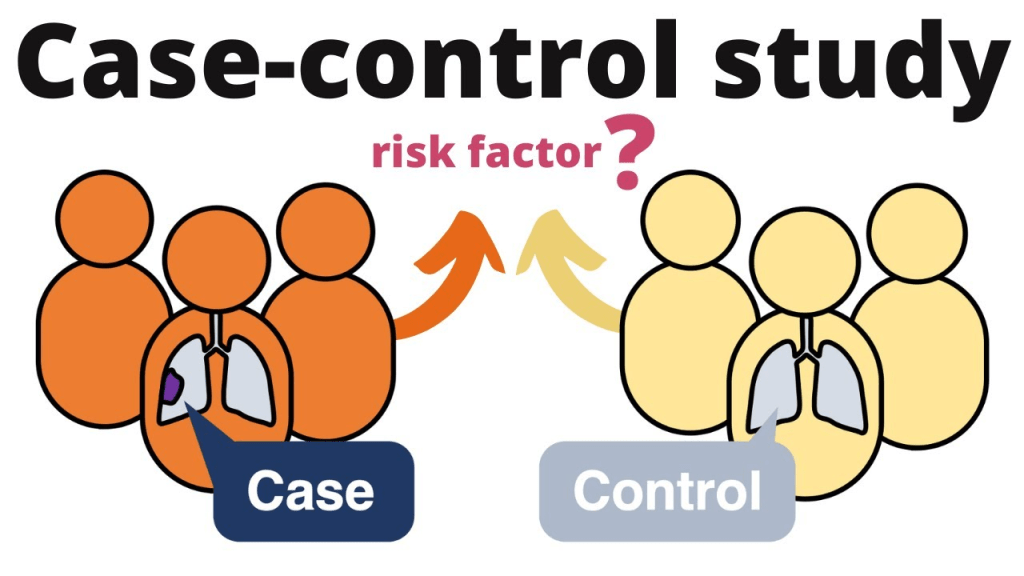
-Figure 3: Henrik’s Lab (2024)
- Cross-Sectional Surveys (WEAK) – snapshot in time to see differences:
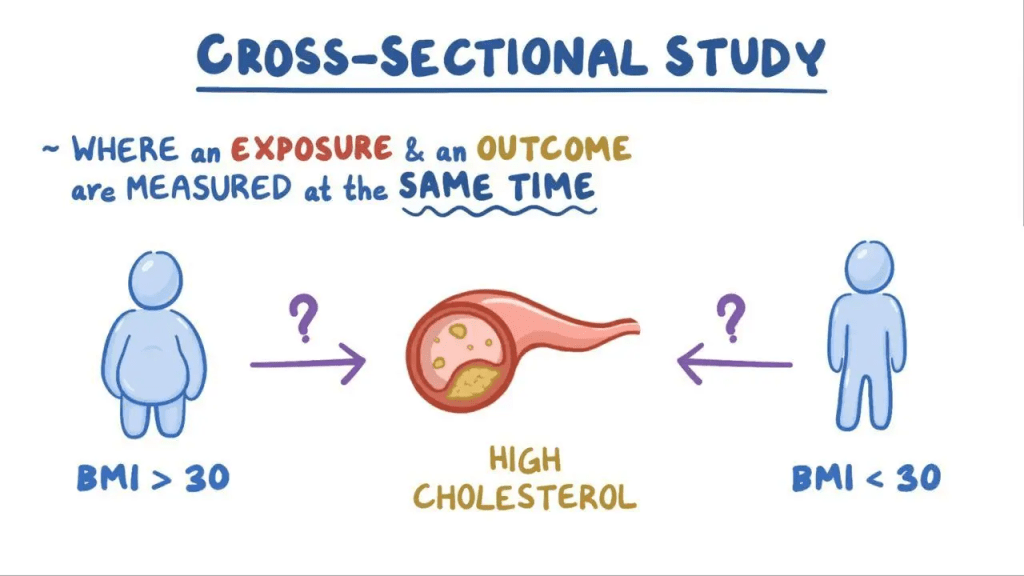
-Figure 4: Osmosis (2025)
- Animal or Cell Studies (all or nothing, but nothing 95% of the time): observing and testing the direct outcomes on animals.
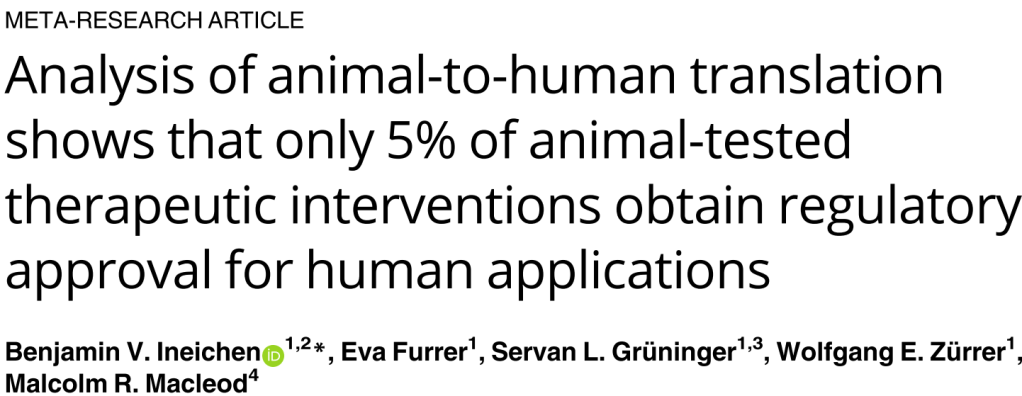
-Figure 5: Ineichen et al. (2024)
The overall proportion of therapies progressing from animal studies was 50% to human studies, 40% to RCTs, and 5% to regulatory approval. Notably, our meta-analysis showed an 86% concordance between positive results in animal and clinical studies. (Ineichen et al.)
In summary:
86% of animal studies match human studies! -> that’s great! But those are mostly weak positives/correlations.
Human bodies are larger, only 5% of the truly positive therapies were significant.
- Anecdotal/Expert Opinion (WEAKEST) — Doctor says “Supplement works because patients with condition A took it and improved”

Yeah, mostly good but no thanks unless papers have supported it.
2. Statistical Strength:
- Sample Size: 30-50 participants in humans is not good enough. Different sizes depending on the type of study.
- Controls: a control group with no treatment that does not receive the intervention.
- Randomization: avoids selection bias.
- Blinding: both sides unaware of the groups to avoid bias.
- P-Values & Confidence Intervals:
P-Value:
- Heads or tails, the probability of guessing right is 50%, with a p-value of 0.5 for a single flip.
- But if you flip a coin 10 times and call heads right 9/10 times, that gives a p-value of ~0.011.
- This makes the coin very likely rigged, because the chance of that randomly happening is about 1%.
Same thing applies to scientific studies — the p-value tells you the odds that your result could have happened by random chance.
So if a study reports p = 0.01, it means there’s only a 1% chance the result would occur if the treatment had no real effect.
The lower the p-value, the stronger the evidence against randomness — and the more valid the result appears.

-Figure 6: McLeod (2023)
| P-Value | Interpretation |
|---|---|
| < 0.05 | Unlikely to occur by chance ->Possibly a real effect |
| 0.05–0.10 | Weak evidence -> Not convincing |
| 0.10–0.50 | Likely due to chance |
| > 0.50 | Very likely due to chance -> Strong evidence of no effect |
Confidence Intervals:
Let’s say we measure the heights of 100 men in the US, the average height is 5’10”, the confidence interval is 95% = [5’9″, 5’11”] –> we are 95% confident that the true average height of men in the US is between 5’9″ and 5’11”.
If a study finds that a drug lowers blood pressure by 5 mmHg, and the 95% confidence interval is [2, 8], that means:
We’re 95% confident that the true effect of the drug is somewhere between 2 and 8 mmHg. It does not include 0, meaning that the effect is significant.
- Replication / Reproducibility: one-off studies can be flukes, trying the same experiment in different places.
- Peer-Reviewed Source: experts reviewing the study before publication serves as a filter.
3. A real-life example:
Say you’re comparing 2 supplements for sleep, go to examine.com and look up supplements you are interested in:
- Magnesium:
Using https://examine.com/search/?q=magnesium+for+sleep
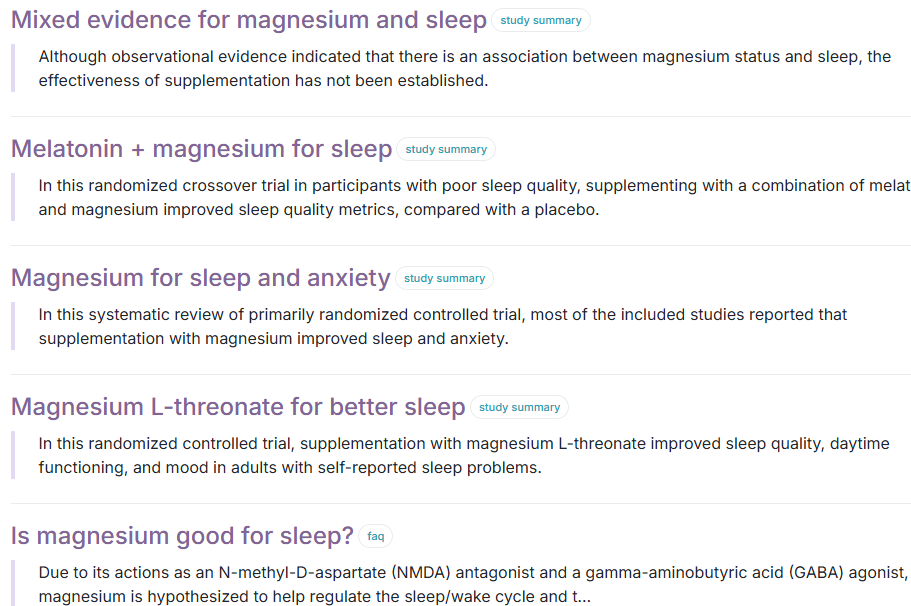
The summary returns: “Magnesium is a popular ingredient in sleep aids, despite mixed results in research. Although supplementation may improve sleep quality in older adults with low magnesium status,[1] the effectiveness of supplementation in other groups has not been established.”
If you want to get more in-depth though, go to:
https://elicit.com/ and look up magnesium and sleep, click on the study.
As seen above, it does seem to aid sleep, but let’s look into it:
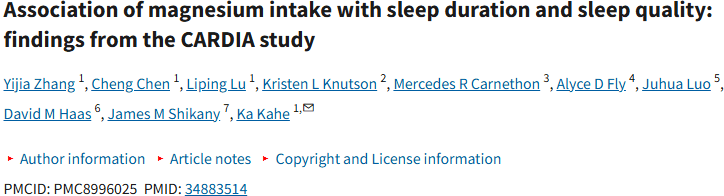
-Figure 7: Zhang et al. (2022)
3,964 participants is a great sample size (GREAT)
In groups Q1 (lowest magnesium intake) to Q4 (highest magnesium intake)
Yet, in their findings they found that:
| Outcome | OR (Q4 vs Q1) | 95% CI | p-trend | Significant? |
|---|---|---|---|---|
| Better sleep quality | 1.23 | 0.999 – 1.50 | 0.051 | Borderline |
| Less short sleep (<7 h) | 0.64 | 0.51 – 0.81 | 0.012 | Statistically significant |
| Less short sleep (no depression) | 0.64 | 0.49 – 0.82 | <0.001 | Highly significant |
OR — odds of outcome occurring in one group vs another (1.0, no difference; greater than 1.0 increased odds; less than 1.0 decreased odds)
CI — the odds of lower sleep are between the two numbers e.g. for outcome “better sleep quality” 0.999 – 1.50, true effect anywhere between no effect “0.999 ” or “1.50” fifty percent chance of better sleep.
p-trend (p-value for trend) — p-trend less than 5 is significant, meaning that there is a 5% chance that it is just a random effect.
In short: High magnesium intake was associated with significantly lower odds of short sleep (<7 hours), especially among individuals without depression, while its link to better sleep quality was borderline significant.
2. Melatonin:

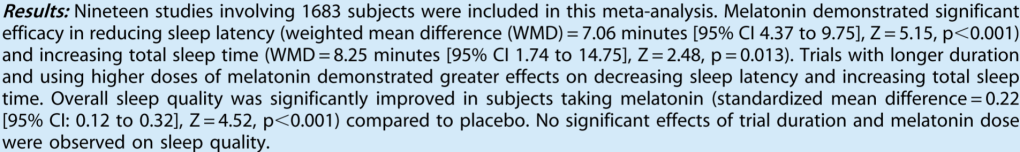
-Figure 8: Ferracioli-Oda et al. (2013)
1,683 participants is a great sample size (GREAT)
| Outcome | Effect Size | 95% CI | p-value | Significant? |
|---|---|---|---|---|
| ↓ Sleep latency (fall asleep faster) | WMD = 7.06 minutes | 4.37 – 9.75 | <0.001 | Statistically significant |
| ↑ Total sleep time | WMD = 8.25 minutes | 1.74 – 14.75 | 0.013 | Statistically significant |
| ↑ Overall sleep quality | SMD = 0.22 | 0.12 – 0.32 | <0.001 | Statistically significant |
WMD = Weighted Mean Difference (used when outcomes are measured in minutes)
SMD = Standardized Mean Difference (used when combining different sleep quality scales)
So we can expect to fall asleep 7 minutes faster, sleep 8 minutes more, and see about a 0.22 standard deviation improvement in sleep quality — a modest but meaningful benefit (relative to your starting point).
In conclusion, melatonin is the best choice of the two for trying to improve your sleep.
Sources:
Ferracioli-Oda, E., Qawasmi, A., & Bloch, M. H. (2013).
Meta-analysis: Melatonin for the treatment of primary sleep disorders. PLoS ONE, 8(5), e63773. https://doi.org/10.1371/journal.pone.0063773
Guzek, D., Kołota, A., Lachowicz, K., Skołmowska, D., Stachoń, M., & Głąbska, D. (2022).
Effect of vitamin D supplementation on depression in adults: A systematic review of randomized controlled trials (RCTs). Nutrients, 14(12), 2395. https://doi.org/10.3390/nu14122395
Henrik’s Lab. (2023, January 17).
Randomized control trial (RCT) explained [Video]. YouTube. https://www.youtube.com/watch?v=mWfjbmRZowM
Henrik’s Lab. (2024).
Case-control study explained [Video]. YouTube. https://www.youtube.com/watch?v=gQlXtGTgnOE
Ineichen, C., Held, U., Rácz, I., & Gajewska, M. (2024).
Analysis of animal-to-human translation: A systematic scoping review. PLOS Biology, 21(6), e3002667. https://doi.org/10.1371/journal.pbio.3002667
McLeod, S. A. (2023).
P-value. Simply Psychology. https://www.simplypsychology.org/p-value.html
Osmosis. (n.d.).
Cross-sectional study. Osmosis.org. Retrieved June 21, 2025, from https://www.osmosis.org/learn/Cross_sectional_study
Simkus, J. (2023).
Retrospective cohort study. Simply Psychology. https://www.simplypsychology.org/retrospective-cohort-study.html
Zhang, Y., Chen, C., Lu, L., Knutson, K. L., Carnethon, M. R., Fly, A. D., Luo, J., Haas, D. M., Shikany, J. M., & Kahe, K. (2022).
Association of magnesium intake with sleep duration and sleep quality: Findings from the CARDIA study. Nutrients, 14(3), 1097. https://doi.org/10.3390/nu14031097
