I was walking through Central Park, NY with my younger cousin; a Statistics PhD student at UNC Chappel Hill. “Have you heard about Cutoff Theory?” he asked, I rolled my eyes and replied “Enlighten me”.
“How many times does it take to shuffle a deck of cards for them to be completely shuffled”
“7, I heard of this before”
“Well, there’s more to it, when shuffling, we want to get to perfect randomness — the point where every combination of cards is equally as likely”
“Sure”
“Now you’d expect randomness to build up gradually with each shuffle… but it doesn’t feel that way. Even after five or six shuffles, the deck is still far from truly random. Then, almost suddenly, around the seventh shuffle, it ‘snaps’ into randomness.”
“How does that make sense?”
“For some reason, the transition is incredibly sharp. For a long time, nothing seems to change. Then, in a narrow window, everything does.”
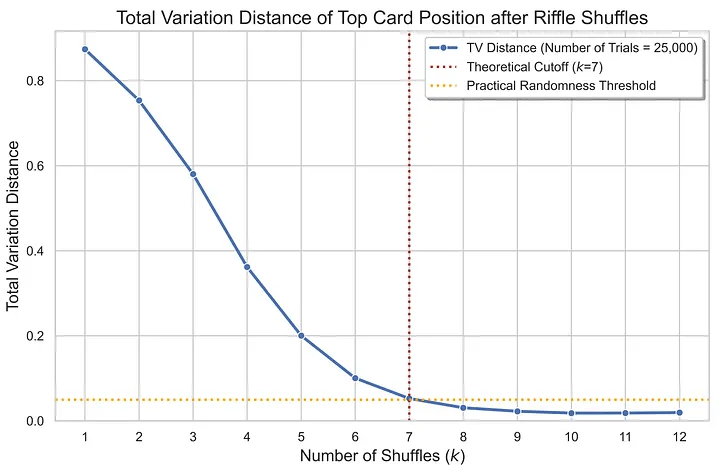
Figure 1 – Rifle Shuffle Variation Cutoff
Total variation distance starts at high at 0.9 gradually decreases then drops sharply between shuffles 6 and 7 after which it remains relatively stable, indicating the onset of near-randomness.”
This left me deep in thought.
I was always fascinated by the concept behind thresholds – how do we measure the point where a car suddenly breaks down or a disease becomes a serious diagnosis.
Systems are influenced by external factors, meaning, a car engine is affected by engine rattle, oil in the engine, weather — when do enough of those accumulate for the car not to work anymore? The gap between something working and not seem to be ruled by laws of invisible probabilities, which are difficult to measure and vary wildly case by case.
Works Cited:
Vaughan, Lee. How to Simulate Card Shuffling with Python — When is a deck fully random? 3/2/2026 https://archive.is/20260306003151/https://medium.com/data-science-collective/how-to-simulate-card-shuffling-with-python-c953c5915f25
